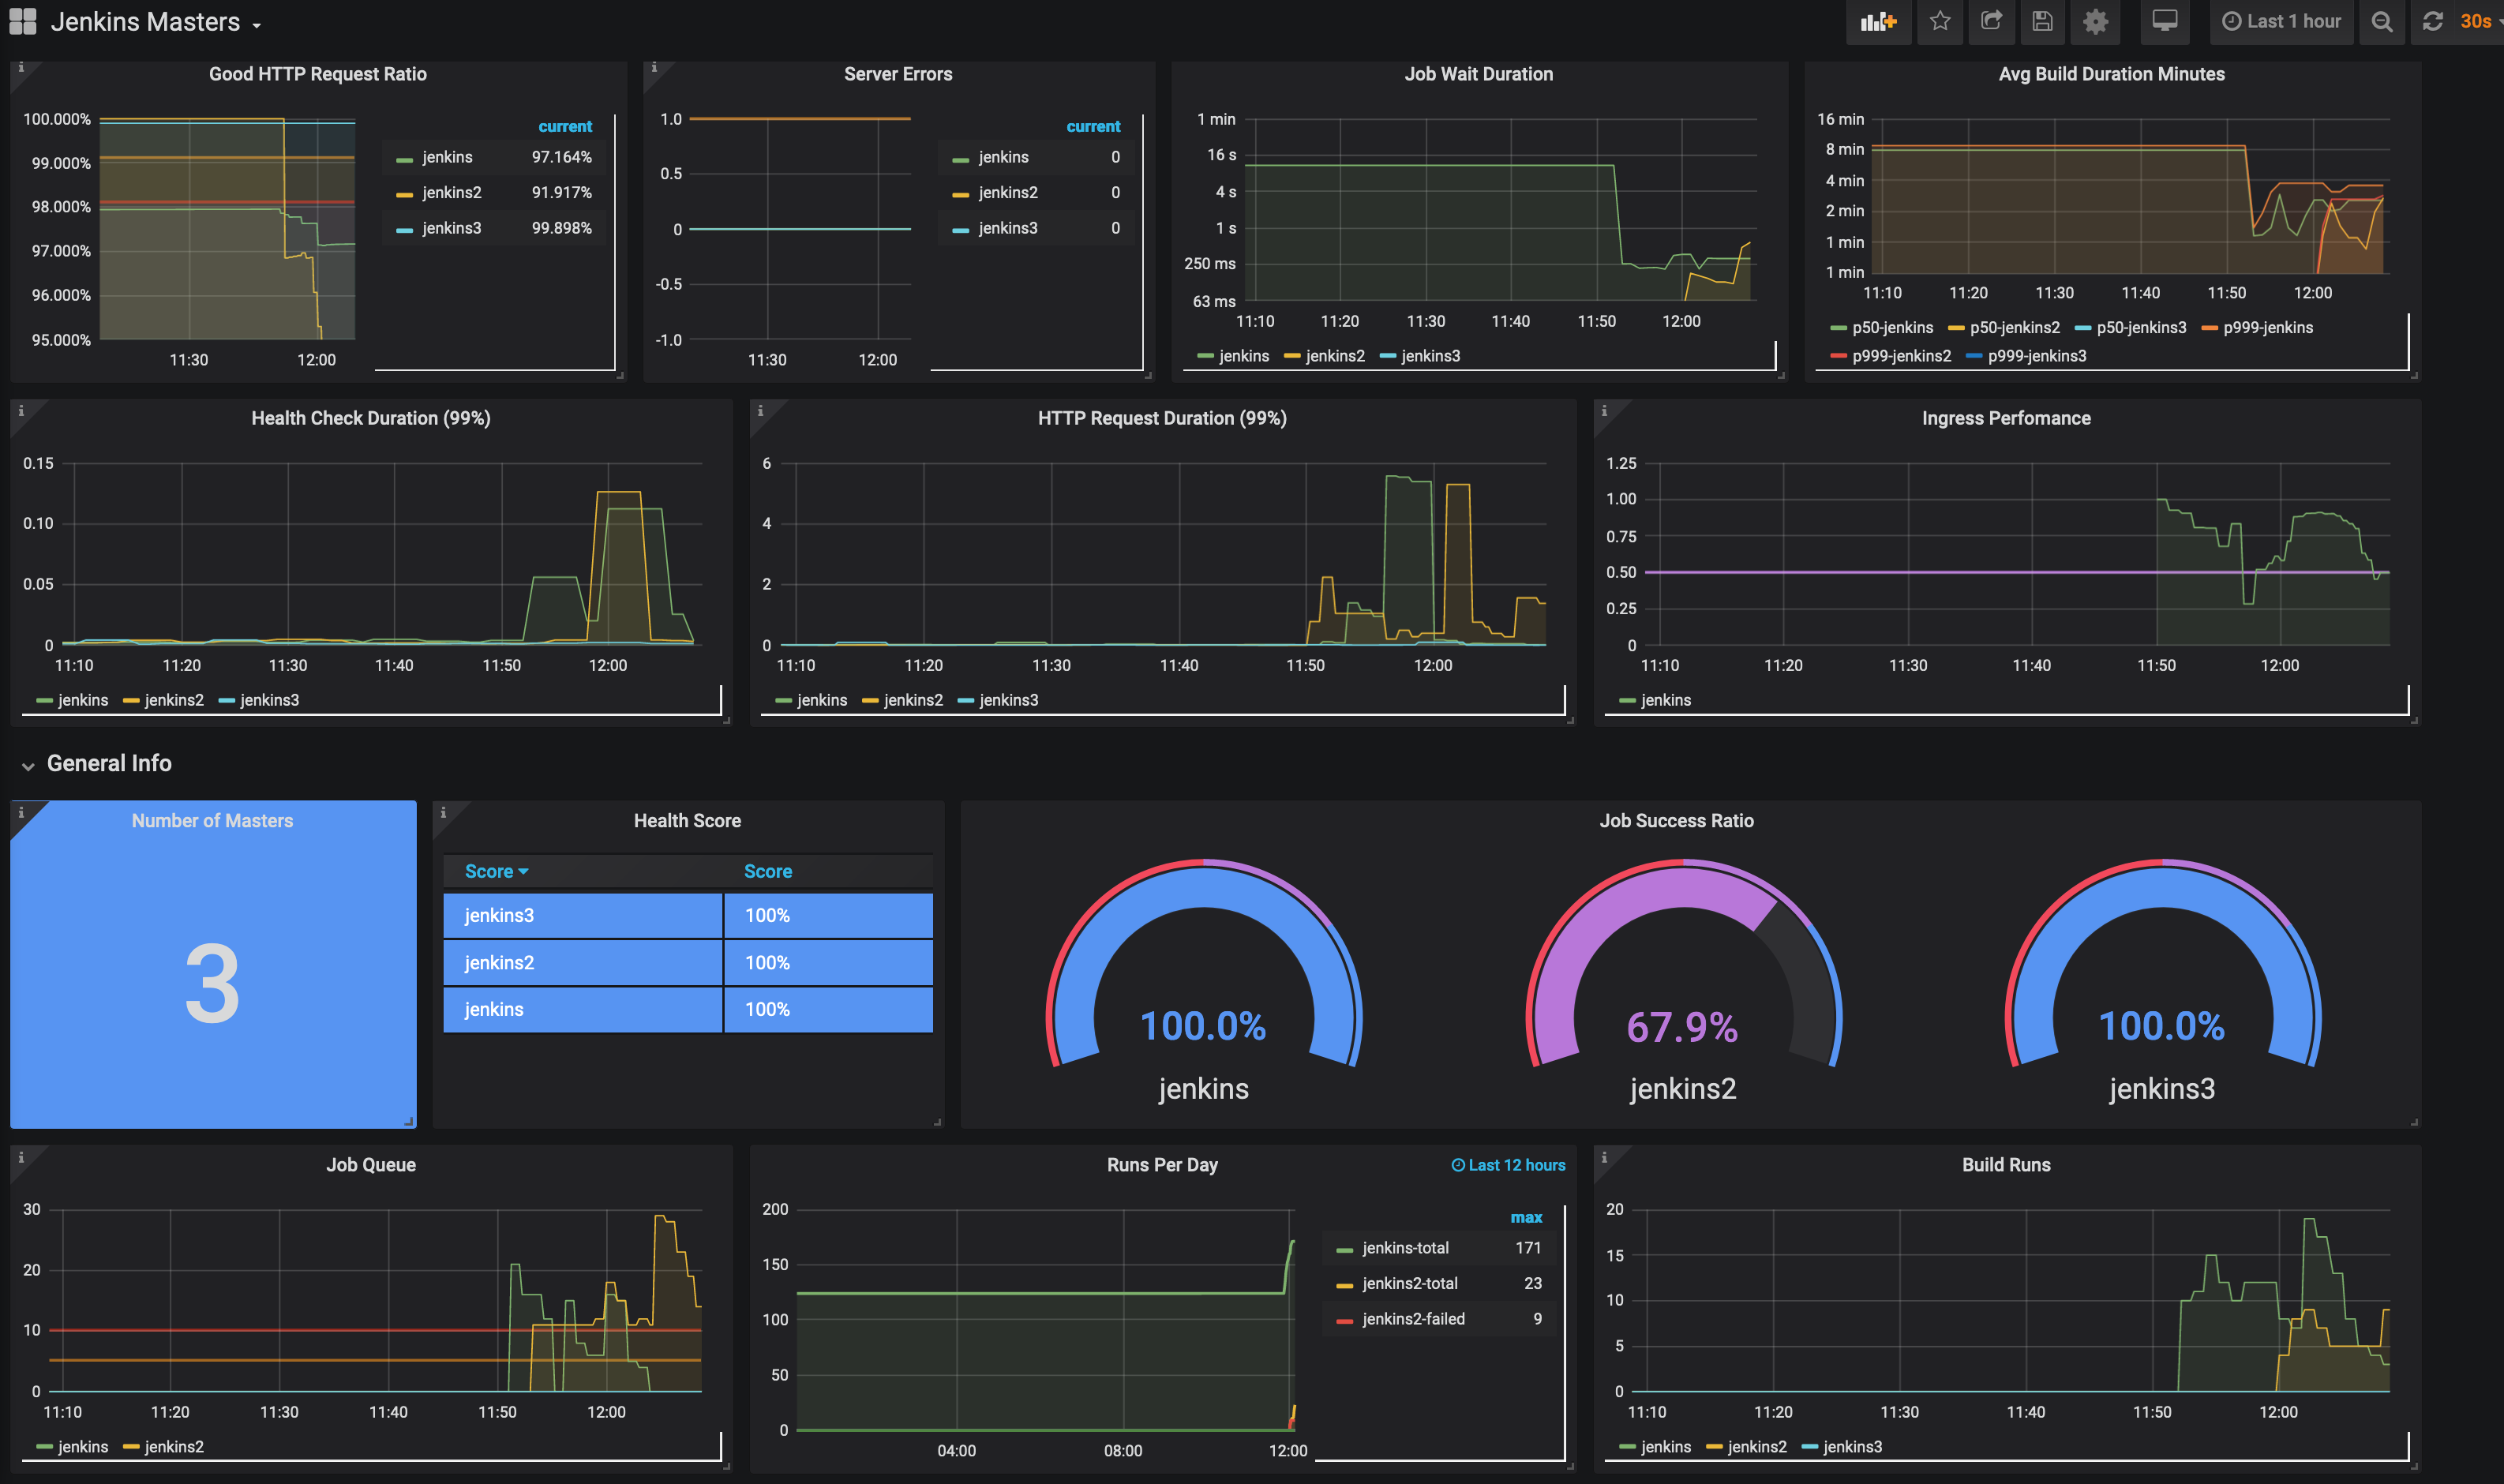
Grafana Dashboard
Example Screenshot
Grafana Variables
- cluster
- type:
datasource - datasource type:
prometheus
- type:
- node
- type:
query - query:
label_values(kube_node_info{component="kube-state-metrics"}, node) - label:
K8S Node - multivalue
- include all
- type:
- namespace
- type:
query - query:
label_values(jenkins_health_check_duration, kubernetes_namespace) - label:
Namespace - multivalue
- include all
- type:
- instance
- type:
query - query:
label_values(jenkins_health_check_duration, app_kubernetes_io_instance) - label:
Master - multivalue
- include all
- type:
Dashboard json
{
"annotations": {
"list": [
{
"builtIn": 1,
"datasource": "-- Grafana --",
"enable": true,
"hide": true,
"iconColor": "rgba(0, 211, 255, 1)",
"name": "Annotations & Alerts",
"type": "dashboard"
}
]
},
"description": "Dashboard for when you are using multiple Jenkins Masters",
"editable": true,
"gnetId": null,
"graphTooltip": 1,
"id": 9,
"iteration": 1565906968208,
"links": [],
"panels": [
{
"collapsed": false,
"gridPos": {
"h": 1,
"w": 24,
"x": 0,
"y": 0
},
"id": 20,
"panels": [],
"title": "Performance",
"type": "row"
},
{
"aliasColors": {},
"bars": false,
"dashLength": 10,
"dashes": false,
"decimals": 3,
"description": "The ratio of ok (200) request out of all requests.",
"fill": 1,
"gridPos": {
"h": 6,
"w": 6,
"x": 0,
"y": 1
},
"id": 36,
"legend": {
"alignAsTable": true,
"avg": false,
"current": true,
"max": false,
"min": false,
"rightSide": true,
"show": true,
"total": false,
"values": true
},
"lines": true,
"linewidth": 1,
"links": [],
"nullPointMode": "null",
"options": {},
"percentage": false,
"pointradius": 2,
"points": false,
"renderer": "flot",
"seriesOverrides": [],
"spaceLength": 10,
"stack": false,
"steppedLine": false,
"targets": [
{
"expr": "sum(http_responseCodes_ok_total{kubernetes_namespace=~\"$namespace\", app_kubernetes_io_instance=~\"$instance\"}) \nby (app_kubernetes_io_instance) / \nsum(http_requests_count{kubernetes_namespace=~\"$namespace\", app_kubernetes_io_instance=~\"$instance\"}) \nby (app_kubernetes_io_instance)",
"format": "time_series",
"intervalFactor": 1,
"legendFormat": "{{app_kubernetes_io_instance}}",
"refId": "A"
}
],
"thresholds": [
{
"colorMode": "warning",
"fill": true,
"line": true,
"op": "lt",
"value": 0.991,
"yaxis": "left"
},
{
"colorMode": "critical",
"fill": true,
"line": true,
"op": "lt",
"value": 0.981,
"yaxis": "left"
}
],
"timeFrom": null,
"timeRegions": [],
"timeShift": null,
"title": "Good HTTP Request Ratio",
"tooltip": {
"shared": true,
"sort": 0,
"value_type": "individual"
},
"type": "graph",
"xaxis": {
"buckets": null,
"mode": "time",
"name": null,
"show": true,
"values": []
},
"yaxes": [
{
"decimals": 3,
"format": "percentunit",
"label": null,
"logBase": 1,
"max": "1",
"min": "0.95",
"show": true
},
{
"format": "short",
"label": null,
"logBase": 1,
"max": null,
"min": null,
"show": false
}
],
"yaxis": {
"align": false,
"alignLevel": null
}
},
{
"aliasColors": {},
"bars": false,
"dashLength": 10,
"dashes": false,
"decimals": 0,
"description": "Http Server Errors (500)",
"fill": 1,
"gridPos": {
"h": 6,
"w": 5,
"x": 6,
"y": 1
},
"id": 38,
"legend": {
"alignAsTable": true,
"avg": false,
"current": true,
"hideEmpty": true,
"hideZero": false,
"max": false,
"min": false,
"rightSide": true,
"show": true,
"total": false,
"values": true
},
"lines": true,
"linewidth": 1,
"links": [],
"nullPointMode": "null",
"options": {},
"percentage": false,
"pointradius": 2,
"points": false,
"renderer": "flot",
"seriesOverrides": [],
"spaceLength": 10,
"stack": false,
"steppedLine": false,
"targets": [
{
"expr": "http_responseCodes_serverError_total{kubernetes_namespace=~\"$namespace\", app_kubernetes_io_instance=~\"$instance\"}",
"format": "time_series",
"intervalFactor": 1,
"legendFormat": "{{app_kubernetes_io_instance}}",
"refId": "A"
}
],
"thresholds": [
{
"colorMode": "warning",
"fill": true,
"line": true,
"op": "gt",
"value": 1,
"yaxis": "left"
}
],
"timeFrom": null,
"timeRegions": [],
"timeShift": null,
"title": "Server Errors",
"tooltip": {
"shared": true,
"sort": 0,
"value_type": "individual"
},
"type": "graph",
"xaxis": {
"buckets": null,
"mode": "time",
"name": null,
"show": true,
"values": []
},
"yaxes": [
{
"format": "short",
"label": null,
"logBase": 1,
"max": null,
"min": null,
"show": true
},
{
"format": "short",
"label": null,
"logBase": 1,
"max": null,
"min": null,
"show": true
}
],
"yaxis": {
"align": false,
"alignLevel": null
}
},
{
"aliasColors": {},
"bars": false,
"dashLength": 10,
"dashes": false,
"fill": 1,
"gridPos": {
"h": 6,
"w": 6,
"x": 11,
"y": 1
},
"id": 42,
"interval": "1m",
"legend": {
"avg": false,
"current": false,
"max": false,
"min": false,
"show": true,
"total": false,
"values": false
},
"lines": true,
"linewidth": 1,
"links": [],
"nullPointMode": "null",
"options": {},
"percentage": false,
"pointradius": 2,
"points": false,
"renderer": "flot",
"seriesOverrides": [],
"spaceLength": 10,
"stack": false,
"steppedLine": false,
"targets": [
{
"expr": "sum (jenkins_job_waiting_duration{kubernetes_namespace=~\"$namespace\", app_kubernetes_io_instance=~\"$instance\"}) by (app_kubernetes_io_instance)",
"format": "time_series",
"instant": false,
"intervalFactor": 1,
"legendFormat": "{{app_kubernetes_io_instance}}",
"refId": "A"
}
],
"thresholds": [],
"timeFrom": null,
"timeRegions": [],
"timeShift": null,
"title": "Job Wait Duration",
"tooltip": {
"shared": true,
"sort": 0,
"value_type": "individual"
},
"type": "graph",
"xaxis": {
"buckets": null,
"mode": "time",
"name": null,
"show": true,
"values": []
},
"yaxes": [
{
"format": "s",
"label": null,
"logBase": 2,
"max": null,
"min": null,
"show": true
},
{
"format": "short",
"label": null,
"logBase": 1,
"max": null,
"min": null,
"show": false
}
],
"yaxis": {
"align": false,
"alignLevel": null
}
},
{
"aliasColors": {},
"bars": false,
"dashLength": 10,
"dashes": false,
"fill": 1,
"gridPos": {
"h": 6,
"w": 6,
"x": 17,
"y": 1
},
"id": 44,
"interval": "1m",
"legend": {
"avg": false,
"current": false,
"hideEmpty": false,
"hideZero": false,
"max": false,
"min": false,
"show": true,
"total": false,
"values": false
},
"lines": true,
"linewidth": 1,
"links": [],
"nullPointMode": "null",
"options": {},
"percentage": false,
"pointradius": 2,
"points": false,
"renderer": "flot",
"seriesOverrides": [],
"spaceLength": 10,
"stack": false,
"steppedLine": false,
"targets": [
{
"expr": "sum(jenkins_job_building_duration{quantile=\"0.5\",kubernetes_namespace=~\"$namespace\", app_kubernetes_io_instance=~\"$instance\"})\nby (app_kubernetes_io_instance) / 60",
"format": "time_series",
"instant": false,
"interval": "",
"intervalFactor": 1,
"legendFormat": "p50-{{app_kubernetes_io_instance}}",
"refId": "A"
},
{
"expr": "sum(jenkins_node_builds{quantile=\"0.999\",kubernetes_namespace=~\"$namespace\", app_kubernetes_io_instance=~\"$instance\"})\nby (app_kubernetes_io_instance) / 60",
"format": "time_series",
"intervalFactor": 1,
"legendFormat": "p999-{{app_kubernetes_io_instance}}",
"refId": "B"
}
],
"thresholds": [],
"timeFrom": null,
"timeRegions": [],
"timeShift": null,
"title": "Avg Build Duration Minutes",
"tooltip": {
"shared": true,
"sort": 0,
"value_type": "individual"
},
"type": "graph",
"xaxis": {
"buckets": null,
"mode": "time",
"name": null,
"show": true,
"values": []
},
"yaxes": [
{
"format": "m",
"label": null,
"logBase": 2,
"max": null,
"min": null,
"show": true
},
{
"decimals": 1,
"format": "m",
"label": null,
"logBase": 1,
"max": null,
"min": null,
"show": false
}
],
"yaxis": {
"align": false,
"alignLevel": null
}
},
{
"aliasColors": {},
"bars": false,
"dashLength": 10,
"dashes": false,
"description": "How long the health check takes to complete at the 99th percentile.\nHigher numbers signify problems",
"fill": 1,
"gridPos": {
"h": 6,
"w": 7,
"x": 0,
"y": 7
},
"id": 18,
"interval": "1m",
"legend": {
"avg": false,
"current": false,
"hideEmpty": true,
"hideZero": true,
"max": false,
"min": false,
"show": true,
"total": false,
"values": false
},
"lines": true,
"linewidth": 1,
"links": [],
"nullPointMode": "null as zero",
"options": {},
"percentage": false,
"pointradius": 2,
"points": false,
"renderer": "flot",
"seriesOverrides": [],
"spaceLength": 10,
"stack": false,
"steppedLine": false,
"targets": [
{
"expr": "sum(jenkins_health_check_duration{kubernetes_namespace=~\"$namespace\", app_kubernetes_io_instance=~\"$instance\", quantile=\"0.99\"}) \n by (app_kubernetes_io_instance)",
"format": "time_series",
"intervalFactor": 1,
"legendFormat": "{{app_kubernetes_io_instance}}",
"refId": "A"
}
],
"thresholds": [],
"timeFrom": null,
"timeRegions": [],
"timeShift": null,
"title": "Health Check Duration (99%)",
"tooltip": {
"shared": true,
"sort": 0,
"value_type": "individual"
},
"type": "graph",
"xaxis": {
"buckets": null,
"mode": "time",
"name": null,
"show": true,
"values": []
},
"yaxes": [
{
"format": "short",
"label": null,
"logBase": 1,
"max": null,
"min": null,
"show": true
},
{
"format": "short",
"label": null,
"logBase": 1,
"max": null,
"min": null,
"show": true
}
],
"yaxis": {
"align": false,
"alignLevel": null
}
},
{
"aliasColors": {},
"bars": false,
"dashLength": 10,
"dashes": false,
"description": "The 99% percentile of HTTP Requests handled by Jenkins masters.",
"fill": 1,
"gridPos": {
"h": 6,
"w": 8,
"x": 7,
"y": 7
},
"id": 52,
"legend": {
"avg": false,
"current": false,
"max": false,
"min": false,
"show": true,
"total": false,
"values": false
},
"lines": true,
"linewidth": 1,
"links": [],
"nullPointMode": "null",
"options": {},
"percentage": false,
"pointradius": 2,
"points": false,
"renderer": "flot",
"seriesOverrides": [],
"spaceLength": 10,
"stack": false,
"steppedLine": false,
"targets": [
{
"expr": "sum(http_requests{kubernetes_namespace=~\"$namespace\", app_kubernetes_io_instance=~\"$instance\",quantile=\"0.99\"} ) by (app_kubernetes_io_instance)",
"format": "time_series",
"intervalFactor": 1,
"legendFormat": "{{app_kubernetes_io_instance}}",
"refId": "A"
}
],
"thresholds": [],
"timeFrom": null,
"timeRegions": [],
"timeShift": null,
"title": "HTTP Request Duration (99%)",
"tooltip": {
"shared": true,
"sort": 0,
"value_type": "individual"
},
"type": "graph",
"xaxis": {
"buckets": null,
"mode": "time",
"name": null,
"show": true,
"values": []
},
"yaxes": [
{
"format": "short",
"label": null,
"logBase": 1,
"max": null,
"min": null,
"show": true
},
{
"format": "short",
"label": null,
"logBase": 1,
"max": null,
"min": null,
"show": true
}
],
"yaxis": {
"align": false,
"alignLevel": null
}
},
{
"aliasColors": {},
"bars": false,
"dashLength": 10,
"dashes": false,
"description": "Shows performance of Ingress Controller connection that lasts longer than 250 milliseconds",
"fill": 1,
"gridPos": {
"h": 6,
"w": 8,
"x": 15,
"y": 7
},
"id": 32,
"legend": {
"avg": false,
"current": false,
"max": false,
"min": false,
"show": true,
"total": false,
"values": false
},
"lines": true,
"linewidth": 1,
"links": [],
"nullPointMode": "null",
"options": {},
"percentage": false,
"pointradius": 2,
"points": false,
"renderer": "flot",
"seriesOverrides": [],
"spaceLength": 10,
"stack": false,
"steppedLine": false,
"targets": [
{
"expr": "sum(rate(\n nginx_ingress_controller_request_duration_seconds_bucket{\n le=\"0.25\",\n namespace=~\"$namespace\",\n ingress=~\"jenkins*\"\n }[5m]\n)) \nby (ingress) / \nsum(rate(\n nginx_ingress_controller_request_duration_seconds_count{\n namespace=~\"$namespace\",\n ingress=~\"jenkins*\"\n }[5m]\n)) \nby (ingress) ",
"format": "time_series",
"intervalFactor": 1,
"legendFormat": "{{ingress}}",
"refId": "A"
}
],
"thresholds": [
{
"colorMode": "custom",
"fill": false,
"fillColor": "rgba(50, 116, 217, 0.2)",
"line": true,
"lineColor": "#B877D9",
"op": "gt",
"value": 0.5,
"yaxis": "left"
},
{
"colorMode": "warning",
"fill": false,
"fillColor": "rgba(50, 116, 217, 0.2)",
"line": true,
"lineColor": "rgba(31, 96, 196, 0.6)",
"op": "gt",
"value": 1.5,
"yaxis": "left"
},
{
"colorMode": "critical",
"fill": false,
"line": true,
"op": "gt",
"value": 3,
"yaxis": "left"
}
],
"timeFrom": null,
"timeRegions": [],
"timeShift": null,
"title": "Ingress Perfomance",
"tooltip": {
"shared": true,
"sort": 0,
"value_type": "individual"
},
"type": "graph",
"xaxis": {
"buckets": null,
"mode": "time",
"name": null,
"show": true,
"values": []
},
"yaxes": [
{
"format": "short",
"label": null,
"logBase": 1,
"max": null,
"min": null,
"show": true
},
{
"format": "short",
"label": null,
"logBase": 1,
"max": null,
"min": null,
"show": true
}
],
"yaxis": {
"align": false,
"alignLevel": null
}
},
{
"collapsed": false,
"gridPos": {
"h": 1,
"w": 24,
"x": 0,
"y": 13
},
"id": 12,
"panels": [],
"title": "General Info",
"type": "row"
},
{
"cacheTimeout": null,
"colorBackground": true,
"colorPostfix": false,
"colorValue": false,
"colors": [
"#F2495C",
"#FFCB7D",
"#5794F2"
],
"description": "Amount of Masters healthy",
"format": "none",
"gauge": {
"maxValue": 100,
"minValue": 0,
"show": false,
"thresholdLabels": false,
"thresholdMarkers": true
},
"gridPos": {
"h": 6,
"w": 4,
"x": 0,
"y": 14
},
"id": 26,
"interval": null,
"links": [],
"mappingType": 1,
"mappingTypes": [
{
"name": "value to text",
"value": 1
},
{
"name": "range to text",
"value": 2
}
],
"maxDataPoints": 100,
"nullPointMode": "connected",
"nullText": null,
"options": {},
"pluginVersion": "6.2.4",
"postfix": "",
"postfixFontSize": "50%",
"prefix": "",
"prefixFontSize": "50%",
"rangeMaps": [
{
"from": "null",
"text": "N/A",
"to": "null"
}
],
"sparkline": {
"fillColor": "rgba(31, 118, 189, 0.18)",
"full": false,
"lineColor": "rgb(31, 120, 193)",
"show": false
},
"tableColumn": "",
"targets": [
{
"expr": "sum(jenkins_health_check_score{kubernetes_namespace=~\"$namespace\", app_kubernetes_io_instance=~\"$instance\"})",
"format": "time_series",
"intervalFactor": 1,
"legendFormat": "",
"refId": "A"
}
],
"thresholds": "0,1",
"timeFrom": null,
"timeShift": null,
"title": "Number of Masters",
"type": "singlestat",
"valueFontSize": "200%",
"valueMaps": [
{
"op": "=",
"text": "N/A",
"value": "null"
}
],
"valueName": "current"
},
{
"cacheTimeout": null,
"columns": [
{
"text": "Avg",
"value": "avg"
}
],
"description": "Dropwizard based Health Score derived from other metrics",
"fontSize": "100%",
"gridPos": {
"h": 6,
"w": 5,
"x": 4,
"y": 14
},
"id": 40,
"links": [],
"options": {},
"pageSize": 5,
"pluginVersion": "6.2.4",
"scroll": true,
"showHeader": true,
"sort": {
"col": 0,
"desc": true
},
"styles": [
{
"alias": "Score",
"colorMode": "row",
"colors": [
"#5794F2",
"#FF9830",
"#F2495C"
],
"decimals": 0,
"pattern": "/.*/",
"thresholds": [
"90",
"95"
],
"type": "number",
"unit": "percentunit"
}
],
"targets": [
{
"expr": "jenkins_health_check_score{kubernetes_namespace=~\"$namespace\", app_kubernetes_io_instance=~\"$instance\"}",
"format": "time_series",
"instant": true,
"intervalFactor": 1,
"legendFormat": "{{app_kubernetes_io_instance}}",
"refId": "A"
}
],
"timeFrom": null,
"timeShift": null,
"title": "Health Score",
"transform": "timeseries_aggregations",
"type": "table"
},
{
"gridPos": {
"h": 6,
"w": 14,
"x": 9,
"y": 14
},
"id": 46,
"links": [],
"options": {
"fieldOptions": {
"calcs": [
"last"
],
"defaults": {
"decimals": 1,
"max": 100,
"min": 0,
"title": "",
"unit": "percent"
},
"mappings": [],
"override": {},
"thresholds": [
{
"color": "red",
"index": 0,
"value": null
},
{
"color": "purple",
"index": 1,
"value": 50
},
{
"color": "blue",
"index": 2,
"value": 75
}
],
"values": false
},
"orientation": "auto",
"showThresholdLabels": false,
"showThresholdMarkers": true
},
"pluginVersion": "6.2.4",
"targets": [
{
"expr": "sum(jenkins_runs_success_total{kubernetes_namespace=~\"$namespace\", app_kubernetes_io_instance=~\"$instance\"})\nby (app_kubernetes_io_instance) /\nsum(jenkins_runs_total_total{kubernetes_namespace=~\"$namespace\", app_kubernetes_io_instance=~\"$instance\"})\nby (app_kubernetes_io_instance) * 100",
"format": "time_series",
"intervalFactor": 1,
"legendFormat": "{{app_kubernetes_io_instance}}",
"refId": "A"
}
],
"timeFrom": null,
"timeShift": null,
"title": "Job Success Ratio",
"type": "gauge"
},
{
"aliasColors": {},
"bars": false,
"dashLength": 10,
"dashes": false,
"decimals": 0,
"description": "Amount of Jobs Currenty in the Queue",
"fill": 1,
"gridPos": {
"h": 6,
"w": 7,
"x": 0,
"y": 20
},
"id": 30,
"legend": {
"alignAsTable": false,
"avg": false,
"current": false,
"hideEmpty": false,
"hideZero": true,
"max": false,
"min": false,
"rightSide": false,
"show": true,
"total": false,
"values": false
},
"lines": true,
"linewidth": 1,
"links": [],
"nullPointMode": "null",
"options": {},
"percentage": false,
"pointradius": 2,
"points": false,
"renderer": "flot",
"seriesOverrides": [],
"spaceLength": 10,
"stack": false,
"steppedLine": false,
"targets": [
{
"expr": "sum(jenkins_queue_size_value{kubernetes_namespace=~\"$namespace\", app_kubernetes_io_instance=~\"$instance\"}) by (app_kubernetes_io_instance)",
"format": "time_series",
"intervalFactor": 1,
"legendFormat": "{{app_kubernetes_io_instance}}",
"refId": "A"
}
],
"thresholds": [
{
"colorMode": "critical",
"fill": false,
"line": true,
"op": "gt",
"value": 10,
"yaxis": "left"
},
{
"colorMode": "warning",
"fill": false,
"line": true,
"op": "gt",
"value": 5,
"yaxis": "left"
}
],
"timeFrom": null,
"timeRegions": [],
"timeShift": null,
"title": "Job Queue",
"tooltip": {
"shared": true,
"sort": 0,
"value_type": "individual"
},
"type": "graph",
"xaxis": {
"buckets": null,
"mode": "time",
"name": null,
"show": true,
"values": []
},
"yaxes": [
{
"format": "short",
"label": null,
"logBase": 1,
"max": null,
"min": null,
"show": true
},
{
"format": "short",
"label": null,
"logBase": 1,
"max": null,
"min": null,
"show": true
}
],
"yaxis": {
"align": false,
"alignLevel": null
}
},
{
"aliasColors": {},
"bars": false,
"cacheTimeout": null,
"dashLength": 10,
"dashes": false,
"decimals": 0,
"fill": 1,
"gridPos": {
"h": 6,
"w": 8,
"x": 7,
"y": 20
},
"hideTimeOverride": false,
"id": 50,
"interval": "",
"legend": {
"alignAsTable": true,
"avg": false,
"current": false,
"hideEmpty": true,
"hideZero": true,
"max": true,
"min": false,
"rightSide": true,
"show": true,
"total": false,
"values": true
},
"lines": true,
"linewidth": 2,
"links": [],
"nullPointMode": "null",
"options": {},
"percentage": false,
"pluginVersion": "6.2.4",
"pointradius": 2,
"points": false,
"renderer": "flot",
"seriesOverrides": [],
"spaceLength": 10,
"stack": false,
"steppedLine": false,
"targets": [
{
"expr": "sum(increase(jenkins_runs_total_total{kubernetes_namespace=~\"$namespace\", app_kubernetes_io_instance=~\"$instance\"}[24h])) by (app_kubernetes_io_instance)",
"format": "time_series",
"interval": "",
"intervalFactor": 1,
"legendFormat": "{{app_kubernetes_io_instance}}-total",
"refId": "A"
},
{
"expr": "sum(increase(jenkins_runs_failure_total{kubernetes_namespace=~\"$namespace\", app_kubernetes_io_instance=~\"$instance\"}[24h])) by (app_kubernetes_io_instance)",
"format": "time_series",
"interval": "",
"intervalFactor": 1,
"legendFormat": "{{app_kubernetes_io_instance}}-failed",
"refId": "B"
},
{
"expr": "sum(increase(jenkins_runs_aborted_total{kubernetes_namespace=~\"$namespace\", app_kubernetes_io_instance=~\"$instance\"}[24h])) by (app_kubernetes_io_instance)",
"format": "time_series",
"interval": "",
"intervalFactor": 1,
"legendFormat": "{{app_kubernetes_io_instance}}-aborted",
"refId": "C"
}
],
"thresholds": [],
"timeFrom": "12h",
"timeRegions": [],
"timeShift": null,
"title": "Runs Per Day",
"tooltip": {
"shared": true,
"sort": 0,
"value_type": "individual"
},
"type": "graph",
"xaxis": {
"buckets": null,
"mode": "time",
"name": null,
"show": true,
"values": []
},
"yaxes": [
{
"decimals": 0,
"format": "short",
"label": null,
"logBase": 1,
"max": null,
"min": null,
"show": true
},
{
"decimals": 0,
"format": "short",
"label": null,
"logBase": 1,
"max": null,
"min": null,
"show": true
}
],
"yaxis": {
"align": false,
"alignLevel": null
}
},
{
"aliasColors": {},
"bars": false,
"dashLength": 10,
"dashes": false,
"description": "Active Build Runs",
"fill": 1,
"gridPos": {
"h": 6,
"w": 8,
"x": 15,
"y": 20
},
"id": 56,
"legend": {
"avg": false,
"current": false,
"max": false,
"min": false,
"show": true,
"total": false,
"values": false
},
"lines": true,
"linewidth": 1,
"links": [],
"nullPointMode": "null",
"options": {},
"percentage": false,
"pointradius": 2,
"points": false,
"renderer": "flot",
"seriesOverrides": [],
"spaceLength": 10,
"stack": false,
"steppedLine": false,
"targets": [
{
"expr": "sum(jenkins_executor_in_use_history{kubernetes_namespace=~\"$namespace\", app_kubernetes_io_instance=~\"$instance\"}) by (app_kubernetes_io_instance)",
"format": "time_series",
"intervalFactor": 1,
"legendFormat": "{{app_kubernetes_io_instance}}",
"refId": "A"
}
],
"thresholds": [],
"timeFrom": null,
"timeRegions": [],
"timeShift": null,
"title": "Build Runs",
"tooltip": {
"shared": true,
"sort": 0,
"value_type": "individual"
},
"type": "graph",
"xaxis": {
"buckets": null,
"mode": "time",
"name": null,
"show": true,
"values": []
},
"yaxes": [
{
"format": "short",
"label": null,
"logBase": 1,
"max": null,
"min": null,
"show": true
},
{
"format": "short",
"label": null,
"logBase": 1,
"max": null,
"min": null,
"show": true
}
],
"yaxis": {
"align": false,
"alignLevel": null
}
},
{
"cards": {
"cardPadding": null,
"cardRound": null
},
"color": {
"cardColor": "#F2495C",
"colorScale": "sqrt",
"colorScheme": "interpolateSpectral",
"exponent": 0.8,
"max": null,
"min": 0,
"mode": "spectrum"
},
"dataFormat": "tsbuckets",
"description": "Heatmap of when Jobs are scheduled",
"gridPos": {
"h": 7,
"w": 23,
"x": 0,
"y": 26
},
"heatmap": {},
"hideTimeOverride": false,
"hideZeroBuckets": false,
"highlightCards": true,
"id": 58,
"interval": "5m",
"legend": {
"show": true
},
"links": [],
"options": {},
"reverseYBuckets": false,
"targets": [
{
"expr": "sum(increase(jenkins_runs_total_total{kubernetes_namespace=~\"$namespace\", app_kubernetes_io_instance=~\"$instance\"}[2h])) by (app_kubernetes_io_instance)",
"format": "heatmap",
"instant": false,
"interval": "",
"intervalFactor": 10,
"legendFormat": "{{app_kubernetes_io_instance}}",
"refId": "A"
}
],
"timeFrom": "168h",
"timeShift": null,
"title": "Job Runs Heatmap",
"tooltip": {
"show": true,
"showHistogram": false
},
"type": "heatmap",
"xAxis": {
"show": true
},
"xBucketNumber": null,
"xBucketSize": null,
"yAxis": {
"decimals": 0,
"format": "short",
"logBase": 1,
"max": null,
"min": "0",
"show": true,
"splitFactor": null
},
"yBucketBound": "auto",
"yBucketNumber": null,
"yBucketSize": null
},
{
"columns": [
{
"text": "Current",
"value": "current"
}
],
"description": "Jenkins Master Plugin Count",
"fontSize": "100%",
"gridPos": {
"h": 5,
"w": 7,
"x": 0,
"y": 33
},
"id": 14,
"interval": "1m",
"links": [],
"options": {},
"pageSize": null,
"pluginVersion": "6.2.4",
"scroll": true,
"showHeader": true,
"sort": {
"col": 0,
"desc": true
},
"styles": [
{
"alias": "Time",
"dateFormat": "YYYY-MM-DD HH:mm:ss",
"pattern": "Time",
"type": "date"
},
{
"alias": "Master",
"colorMode": "row",
"colors": [
"#5794F2",
"#FF9830",
"#F2495C"
],
"decimals": 0,
"link": false,
"pattern": "/.*/",
"thresholds": [
"95",
"130"
],
"type": "number",
"unit": "short"
}
],
"targets": [
{
"expr": "jenkins_plugins_active{kubernetes_namespace=~\"$namespace\", app_kubernetes_io_instance=~\"$instance\"}",
"format": "time_series",
"instant": true,
"intervalFactor": 1,
"legendFormat": "{{app_kubernetes_io_instance}}",
"refId": "A"
}
],
"timeFrom": null,
"timeShift": null,
"title": "Plugin Count",
"transform": "timeseries_to_rows",
"type": "table"
},
{
"columns": [
{
"text": "Current",
"value": "current"
}
],
"description": "Amount of plugins that are available for updating",
"fontSize": "100%",
"gridPos": {
"h": 5,
"w": 8,
"x": 7,
"y": 33
},
"id": 22,
"links": [],
"options": {},
"pageSize": null,
"scroll": true,
"showHeader": true,
"sort": {
"col": 0,
"desc": true
},
"styles": [
{
"alias": "Time",
"dateFormat": "YYYY-MM-DD HH:mm:ss",
"pattern": "Time",
"type": "date"
},
{
"alias": "",
"colorMode": "row",
"colors": [
"#5794F2",
"#FF9830",
"#F2495C"
],
"decimals": 0,
"pattern": "/.*/",
"thresholds": [
"3",
"10"
],
"type": "number",
"unit": "short"
}
],
"targets": [
{
"expr": "sum(jenkins_plugins_withUpdate{kubernetes_namespace=~\"$namespace\", app_kubernetes_io_instance=~\"$instance\"}) by (app_kubernetes_io_instance)",
"format": "time_series",
"instant": true,
"intervalFactor": 1,
"legendFormat": "{{app_kubernetes_io_instance}}",
"refId": "A"
}
],
"timeFrom": null,
"timeShift": null,
"title": "Plugin Updates Available",
"transform": "timeseries_aggregations",
"type": "table"
},
{
"columns": [
{
"text": "Current",
"value": "current"
},
{
"text": "Max",
"value": "max"
}
],
"description": "Jenkins Master Job Count",
"fontSize": "100%",
"gridPos": {
"h": 5,
"w": 8,
"x": 15,
"y": 33
},
"id": 16,
"links": [],
"options": {},
"pageSize": null,
"scroll": true,
"showHeader": true,
"sort": {
"col": 0,
"desc": true
},
"styles": [
{
"alias": "Time",
"dateFormat": "YYYY-MM-DD HH:mm:ss",
"pattern": "Time",
"type": "date"
},
{
"alias": "",
"colorMode": "row",
"colors": [
"#F2495C",
"#FF9830",
"#5794F2"
],
"decimals": 0,
"pattern": "/.*/",
"thresholds": [
"1"
],
"type": "number",
"unit": "short"
}
],
"targets": [
{
"expr": "jenkins_job_count_value{kubernetes_namespace=~\"$namespace\", app_kubernetes_io_instance=~\"$instance\"}",
"format": "time_series",
"instant": true,
"intervalFactor": 1,
"legendFormat": "{{app_kubernetes_io_instance}}",
"refId": "A"
}
],
"timeFrom": null,
"timeShift": null,
"title": "Job Count",
"transform": "timeseries_aggregations",
"type": "table"
},
{
"columns": [
{
"text": "Current",
"value": "current"
}
],
"description": "Counts offline build nodes that are connected to this master",
"fontSize": "100%",
"gridPos": {
"h": 6,
"w": 7,
"x": 0,
"y": 38
},
"id": 24,
"links": [],
"options": {},
"pageSize": null,
"scroll": true,
"showHeader": true,
"sort": {
"col": 0,
"desc": true
},
"styles": [
{
"alias": "Time",
"dateFormat": "YYYY-MM-DD HH:mm:ss",
"pattern": "Time",
"type": "date"
},
{
"alias": "",
"colorMode": "row",
"colors": [
"#5794F2",
"#B877D9",
"#F2495C"
],
"decimals": 2,
"pattern": "/.*/",
"thresholds": [
"1",
"3"
],
"type": "number",
"unit": "short"
}
],
"targets": [
{
"expr": "sum(jenkins_node_offline_value{kubernetes_namespace=~\"$namespace\", app_kubernetes_io_instance=~\"$instance\"}) by (app_kubernetes_io_instance)",
"format": "time_series",
"instant": true,
"intervalFactor": 1,
"legendFormat": "{{app_kubernetes_io_instance}}",
"refId": "A"
}
],
"timeFrom": null,
"timeShift": null,
"title": "Offline Nodes",
"transform": "timeseries_aggregations",
"type": "table"
},
{
"cacheTimeout": null,
"columns": [
{
"text": "Current",
"value": "current"
}
],
"description": "Uptime in hours",
"fontSize": "100%",
"gridPos": {
"h": 6,
"w": 8,
"x": 7,
"y": 38
},
"id": 6,
"links": [],
"options": {},
"pageSize": null,
"pluginVersion": "6.2.4",
"scroll": true,
"showHeader": true,
"sort": {
"col": null,
"desc": false
},
"styles": [
{
"alias": "Time",
"dateFormat": "YYYY-MM-DD HH:mm:ss",
"pattern": "Time",
"type": "date"
},
{
"alias": "",
"colorMode": "row",
"colors": [
"#F2495C",
"#FF9830",
"#5794F2"
],
"decimals": 0,
"pattern": "/.*/",
"thresholds": [
"1",
"24"
],
"type": "number",
"unit": "short"
}
],
"targets": [
{
"expr": "vm_uptime_milliseconds{kubernetes_namespace=~\"$namespace\", app_kubernetes_io_instance=~\"$instance\"} / 3600000 ",
"format": "time_series",
"instant": true,
"intervalFactor": 1,
"legendFormat": "{{app_kubernetes_io_instance}}",
"refId": "A"
}
],
"timeFrom": null,
"timeShift": null,
"title": "Uptime",
"transform": "timeseries_aggregations",
"type": "table"
},
{
"columns": [
{
"text": "Current",
"value": "current"
}
],
"description": "The current Master executor count, masters should not have executors, so only 0 is green.",
"fontSize": "100%",
"gridPos": {
"h": 6,
"w": 8,
"x": 15,
"y": 38
},
"id": 34,
"interval": "",
"links": [],
"options": {},
"pageSize": null,
"scroll": true,
"showHeader": true,
"sort": {
"col": 0,
"desc": true
},
"styles": [
{
"alias": "Time",
"dateFormat": "YYYY-MM-DD HH:mm:ss",
"pattern": "Time",
"type": "date"
},
{
"alias": "",
"colorMode": "row",
"colors": [
"#F2495C",
"#FF9830",
"#5794F2"
],
"decimals": 2,
"pattern": "/.*/",
"thresholds": [
"0",
"0",
"1"
],
"type": "number",
"unit": "short"
}
],
"targets": [
{
"expr": "sum(jenkins_executor_count_value{kubernetes_namespace=~\"$namespace\", app_kubernetes_io_instance=~\"$instance\"}) by (app_kubernetes_io_instance)",
"format": "time_series",
"instant": true,
"intervalFactor": 1,
"legendFormat": "{{app_kubernetes_io_instance}}",
"refId": "A"
}
],
"timeFrom": null,
"timeShift": null,
"title": "Master Executor Count",
"transform": "timeseries_aggregations",
"type": "table"
},
{
"collapsed": false,
"gridPos": {
"h": 1,
"w": 24,
"x": 0,
"y": 44
},
"id": 2,
"panels": [],
"title": "JVM Metrics",
"type": "row"
},
{
"aliasColors": {},
"bars": false,
"dashLength": 10,
"dashes": false,
"fill": 1,
"gridPos": {
"h": 7,
"w": 10,
"x": 0,
"y": 45
},
"id": 48,
"legend": {
"avg": false,
"current": false,
"max": false,
"min": false,
"show": true,
"total": false,
"values": false
},
"lines": true,
"linewidth": 1,
"links": [],
"nullPointMode": "null",
"options": {},
"percentage": false,
"pointradius": 2,
"points": false,
"renderer": "flot",
"seriesOverrides": [],
"spaceLength": 10,
"stack": false,
"steppedLine": false,
"targets": [
{
"expr": "1 - sum(vm_gc_G1_Young_Generation_time{kubernetes_namespace=~\"$namespace\", app_kubernetes_io_instance=~\"$instance\"})by (app_kubernetes_io_instance) \n/ \nsum (vm_uptime_milliseconds{kubernetes_namespace=~\"$namespace\", app_kubernetes_io_instance=~\"$instance\"}) by (app_kubernetes_io_instance)",
"format": "time_series",
"instant": false,
"intervalFactor": 1,
"legendFormat": "{{app_kubernetes_io_instance}}",
"refId": "A"
}
],
"thresholds": [
{
"colorMode": "warning",
"fill": true,
"line": true,
"op": "lt",
"value": 0.998,
"yaxis": "left"
},
{
"colorMode": "critical",
"fill": true,
"line": true,
"op": "lt",
"value": 0.98,
"yaxis": "left"
}
],
"timeFrom": null,
"timeRegions": [],
"timeShift": null,
"title": "JVM GC Throughput",
"tooltip": {
"shared": true,
"sort": 0,
"value_type": "individual"
},
"type": "graph",
"xaxis": {
"buckets": null,
"mode": "time",
"name": null,
"show": true,
"values": []
},
"yaxes": [
{
"decimals": 5,
"format": "percentunit",
"label": null,
"logBase": 1,
"max": "1",
"min": null,
"show": true
},
{
"format": "short",
"label": null,
"logBase": 1,
"max": null,
"min": null,
"show": false
}
],
"yaxis": {
"align": false,
"alignLevel": null
}
},
{
"aliasColors": {},
"bars": false,
"dashLength": 10,
"dashes": false,
"description": "Ratio of JVM Memory used",
"fill": 1,
"gridPos": {
"h": 7,
"w": 13,
"x": 10,
"y": 45
},
"id": 10,
"legend": {
"alignAsTable": false,
"avg": false,
"current": false,
"max": false,
"min": false,
"show": true,
"total": false,
"values": false
},
"lines": true,
"linewidth": 2,
"links": [],
"nullPointMode": "null",
"options": {},
"percentage": false,
"pointradius": 2,
"points": false,
"renderer": "flot",
"seriesOverrides": [],
"spaceLength": 10,
"stack": false,
"steppedLine": false,
"targets": [
{
"expr": "sum(vm_memory_heap_usage{kubernetes_namespace=~\"$namespace\", app_kubernetes_io_instance=~\"$instance\"}) by (app_kubernetes_io_instance)",
"format": "time_series",
"intervalFactor": 1,
"legendFormat": "{{app_kubernetes_io_instance}}",
"refId": "A"
}
],
"thresholds": [
{
"colorMode": "critical",
"fill": true,
"line": true,
"op": "gt",
"value": 0.75,
"yaxis": "left"
}
],
"timeFrom": null,
"timeRegions": [],
"timeShift": null,
"title": "Memory Ratio",
"tooltip": {
"shared": true,
"sort": 0,
"value_type": "individual"
},
"type": "graph",
"xaxis": {
"buckets": null,
"mode": "time",
"name": null,
"show": true,
"values": []
},
"yaxes": [
{
"format": "percentunit",
"label": null,
"logBase": 1,
"max": null,
"min": null,
"show": true
},
{
"format": "short",
"label": null,
"logBase": 1,
"max": null,
"min": null,
"show": false
}
],
"yaxis": {
"align": false,
"alignLevel": null
}
},
{
"aliasColors": {},
"bars": false,
"dashLength": 10,
"dashes": false,
"decimals": 4,
"description": "JVM CPU Load",
"fill": 1,
"gridPos": {
"h": 7,
"w": 10,
"x": 0,
"y": 52
},
"id": 4,
"legend": {
"alignAsTable": true,
"avg": false,
"current": true,
"hideEmpty": true,
"hideZero": true,
"max": true,
"min": false,
"rightSide": true,
"show": false,
"total": false,
"values": true
},
"lines": true,
"linewidth": 2,
"links": [],
"nullPointMode": "connected",
"options": {},
"percentage": false,
"pointradius": 1,
"points": false,
"renderer": "flot",
"seriesOverrides": [],
"spaceLength": 10,
"stack": false,
"steppedLine": true,
"targets": [
{
"expr": "vm_cpu_load{kubernetes_namespace=~\"$namespace\", app_kubernetes_io_instance=~\"$instance\"}",
"format": "time_series",
"instant": false,
"intervalFactor": 5,
"legendFormat": "{{app_kubernetes_io_instance}}",
"refId": "A"
}
],
"thresholds": [],
"timeFrom": null,
"timeRegions": [],
"timeShift": null,
"title": "CPU Load",
"tooltip": {
"shared": true,
"sort": 0,
"value_type": "individual"
},
"type": "graph",
"xaxis": {
"buckets": null,
"mode": "time",
"name": null,
"show": true,
"values": []
},
"yaxes": [
{
"format": "short",
"label": "",
"logBase": 1,
"max": null,
"min": null,
"show": true
},
{
"format": "short",
"label": "",
"logBase": 1,
"max": null,
"min": null,
"show": false
}
],
"yaxis": {
"align": false,
"alignLevel": null
}
},
{
"aliasColors": {},
"bars": false,
"dashLength": 10,
"dashes": false,
"decimals": null,
"description": "JVM Memory usage",
"fill": 2,
"gridPos": {
"h": 7,
"w": 13,
"x": 10,
"y": 52
},
"id": 8,
"legend": {
"alignAsTable": true,
"avg": false,
"current": true,
"max": true,
"min": false,
"rightSide": true,
"show": true,
"total": false,
"values": true
},
"lines": true,
"linewidth": 2,
"links": [],
"nullPointMode": "null",
"options": {},
"percentage": false,
"pointradius": 2,
"points": false,
"renderer": "flot",
"seriesOverrides": [],
"spaceLength": 10,
"stack": false,
"steppedLine": false,
"targets": [
{
"expr": "vm_memory_total_used{kubernetes_namespace=~\"$namespace\", app_kubernetes_io_instance=~\"$instance\"}",
"format": "time_series",
"intervalFactor": 2,
"legendFormat": "{{app_kubernetes_io_instance}}",
"refId": "A"
}
],
"thresholds": [],
"timeFrom": null,
"timeRegions": [],
"timeShift": null,
"title": "Memory",
"tooltip": {
"shared": true,
"sort": 1,
"value_type": "individual"
},
"type": "graph",
"xaxis": {
"buckets": null,
"mode": "time",
"name": null,
"show": true,
"values": []
},
"yaxes": [
{
"format": "short",
"label": null,
"logBase": 1,
"max": null,
"min": null,
"show": true
},
{
"format": "short",
"label": null,
"logBase": 1,
"max": null,
"min": null,
"show": true
}
],
"yaxis": {
"align": false,
"alignLevel": null
}
},
{
"aliasColors": {},
"bars": false,
"dashLength": 10,
"dashes": false,
"description": "Lists memory usage of the Pod vs. Kubernetes Requests",
"fill": 1,
"gridPos": {
"h": 8,
"w": 10,
"x": 0,
"y": 59
},
"id": 54,
"legend": {
"avg": false,
"current": false,
"max": false,
"min": false,
"show": true,
"total": false,
"values": false
},
"lines": true,
"linewidth": 1,
"links": [],
"nullPointMode": "connected",
"options": {},
"percentage": false,
"pointradius": 2,
"points": false,
"renderer": "flot",
"seriesOverrides": [],
"spaceLength": 10,
"stack": false,
"steppedLine": false,
"targets": [
{
"expr": "sum (label_join(container_memory_usage_bytes{\n container_name=\"jenkins\",\n namespace=~\"$namespace\"\n }, \n \"pod\", \n \",\", \n \"pod_name\"\n)) by (pod) / \nsum (kube_pod_container_resource_requests_memory_bytes { \n container=\"jenkins\",\n namespace=~\"$namespace\"\n }\n) by (pod)",
"format": "time_series",
"intervalFactor": 1,
"legendFormat": "{{pod}}",
"refId": "A"
}
],
"thresholds": [],
"timeFrom": null,
"timeRegions": [],
"timeShift": null,
"title": "Memory Usage vs. Request",
"tooltip": {
"shared": true,
"sort": 0,
"value_type": "individual"
},
"type": "graph",
"xaxis": {
"buckets": null,
"mode": "time",
"name": null,
"show": true,
"values": []
},
"yaxes": [
{
"format": "short",
"label": null,
"logBase": 1,
"max": null,
"min": null,
"show": true
},
{
"format": "short",
"label": null,
"logBase": 1,
"max": null,
"min": null,
"show": true
}
],
"yaxis": {
"align": false,
"alignLevel": null
}
},
{
"description": "The ratio of open file descriptors\nSee: https://support.cloudbees.com/hc/en-us/articles/204246140-Too-many-open-files",
"gridPos": {
"h": 8,
"w": 5,
"x": 10,
"y": 59
},
"id": 28,
"links": [],
"options": {
"displayMode": "basic",
"fieldOptions": {
"calcs": [
"last"
],
"defaults": {
"max": 1,
"min": 0,
"unit": "percentunit"
},
"mappings": [],
"override": {},
"thresholds": [
{
"color": "blue",
"index": 0,
"value": null
},
{
"color": "orange",
"index": 1,
"value": 60
},
{
"color": "red",
"index": 2,
"value": 80
}
],
"values": false
},
"orientation": "horizontal"
},
"targets": [
{
"expr": "vm_file_descriptor_ratio{kubernetes_namespace=~\"$namespace\", app_kubernetes_io_instance=~\"$instance\"}",
"format": "time_series",
"instant": true,
"intervalFactor": 1,
"legendFormat": "{{app_kubernetes_io_instance}}",
"refId": "A"
}
],
"timeFrom": null,
"timeShift": null,
"title": "File Descriptor Ratio",
"type": "bargauge"
}
],
"refresh": "30s",
"schemaVersion": 18,
"style": "dark",
"tags": [
"Jenkins",
"Prometheus"
],
"templating": {
"list": [
{
"current": {
"text": "Prometheus",
"value": "Prometheus"
},
"hide": 0,
"includeAll": false,
"label": null,
"multi": false,
"name": "cluster",
"options": [],
"query": "prometheus",
"refresh": 1,
"regex": "",
"skipUrlSync": false,
"type": "datasource"
},
{
"allValue": null,
"current": {
"text": "All",
"value": [
"$__all"
]
},
"datasource": "Prometheus",
"definition": "label_values(jenkins_health_check_duration, app_kubernetes_io_instance)",
"hide": 0,
"includeAll": true,
"label": "Master",
"multi": true,
"name": "instance",
"options": [],
"query": "label_values(jenkins_health_check_duration, app_kubernetes_io_instance)",
"refresh": 2,
"regex": "",
"skipUrlSync": false,
"sort": 1,
"tagValuesQuery": "",
"tags": [],
"tagsQuery": "",
"type": "query",
"useTags": false
},
{
"allValue": null,
"current": {
"text": "All",
"value": "$__all"
},
"datasource": "Prometheus",
"definition": "label_values(jenkins_health_check_duration, kubernetes_namespace)",
"hide": 0,
"includeAll": true,
"label": "Namespace",
"multi": true,
"name": "namespace",
"options": [],
"query": "label_values(jenkins_health_check_duration, kubernetes_namespace)",
"refresh": 2,
"regex": "",
"skipUrlSync": false,
"sort": 1,
"tagValuesQuery": "",
"tags": [],
"tagsQuery": "",
"type": "query",
"useTags": false
},
{
"allValue": null,
"current": {
"text": "All",
"value": "$__all"
},
"datasource": "Prometheus",
"definition": "label_values(kube_node_info{component=\"kube-state-metrics\"}, node)",
"hide": 0,
"includeAll": true,
"label": "K8S Node",
"multi": true,
"name": "node",
"options": [],
"query": "label_values(kube_node_info{component=\"kube-state-metrics\"}, node)",
"refresh": 1,
"regex": "",
"skipUrlSync": false,
"sort": 5,
"tagValuesQuery": "",
"tags": [],
"tagsQuery": "",
"type": "query",
"useTags": false
},
{
"allValue": null,
"current": {
"text": "jx-production",
"value": "jx-production"
},
"datasource": "Prometheus",
"definition": "label_values(jenkins_health_check_duration, kubernetes_namespace)",
"hide": 0,
"includeAll": false,
"label": null,
"multi": false,
"name": "Test",
"options": [],
"query": "label_values(jenkins_health_check_duration, kubernetes_namespace)",
"refresh": 2,
"regex": "",
"skipUrlSync": false,
"sort": 1,
"tagValuesQuery": "",
"tags": [],
"tagsQuery": "",
"type": "query",
"useTags": false
}
]
},
"time": {
"from": "now-6h",
"to": "now"
},
"timepicker": {
"refresh_intervals": [
"5s",
"10s",
"30s",
"1m",
"5m",
"15m",
"30m",
"1h",
"2h",
"1d"
],
"time_options": [
"5m",
"15m",
"1h",
"6h",
"12h",
"24h",
"2d",
"7d",
"30d"
]
},
"timezone": "",
"title": "Jenkins Masters",
"uid": "8Z9-POHWz",
"version": 9
}
Last update: 2019-08-27 16:00:18